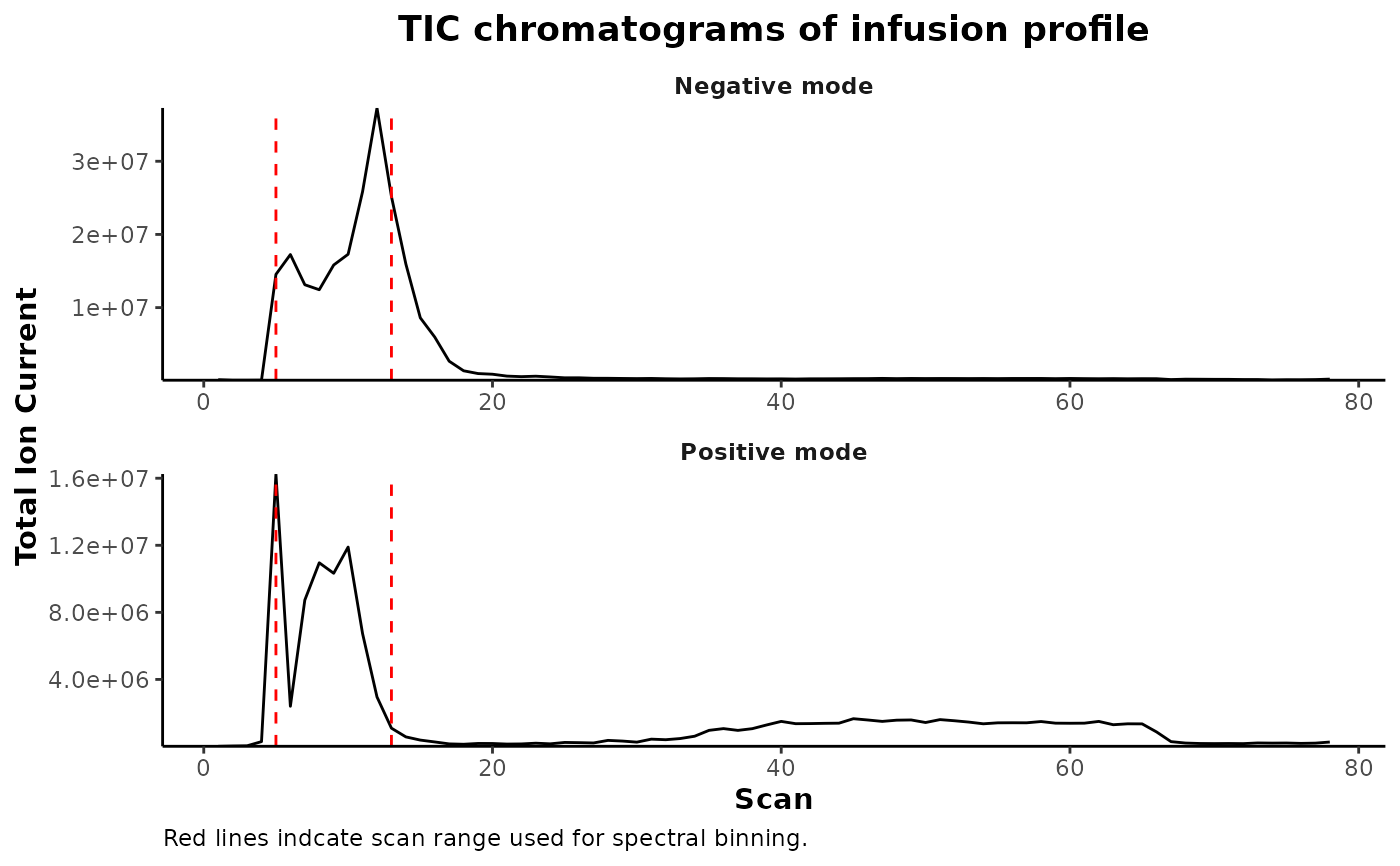
Plot and averaged infusion profile from a vector of specified file paths.
Usage
plotChromFromFile(files, scans = c())Arguments
- files
character vector of file paths to use
- scans
specify scans to highlight within the plot
Examples
file_paths <- system.file('example-data/1.mzML.gz',package = 'binneR')

plotChromFromFile(file_paths,
                  scans = detectInfusionScans(file_paths))